Key Figures
Statistical Data
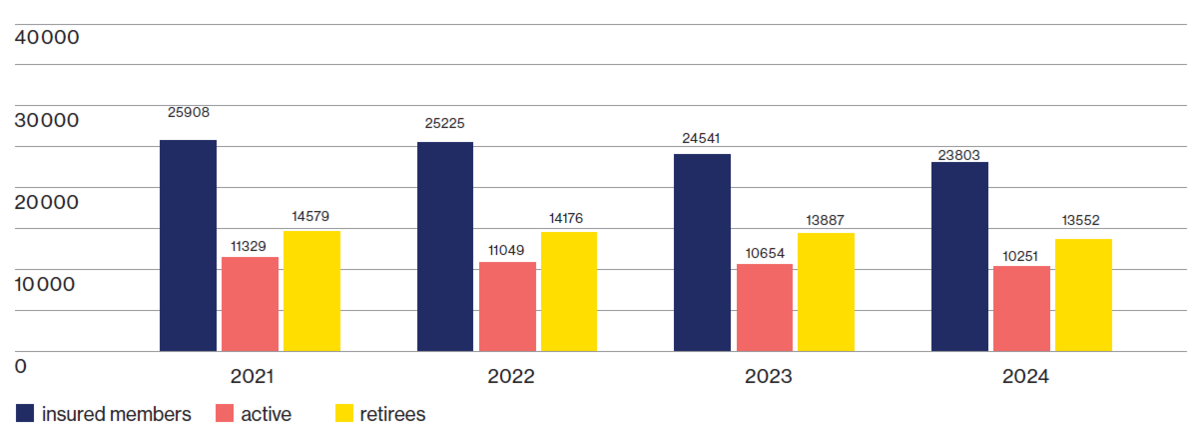
Let us start with some statistical data on Novartis Pension Fund 1 as reported in the actuarial statement: On 31 December 2021, there were 11 329 (previous year: 12 118) actively insured members compared with 14 579 (previous year: 14 896) retirees, of whom 9 282 had reached retirement age, 336 were drawing a disability pension, and 4 532 were drawing a widow(er)’s pension. Orphans’ and children’s pensions accounted for a further 429 current pensions. The average current pension income amounted to CHF 40 555 (previous year: CHF 40 638).
Coverage Ratio
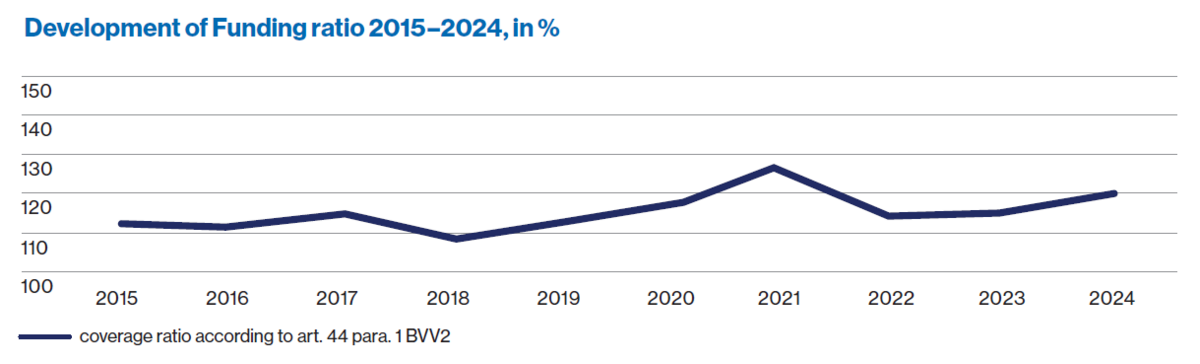
The funding ratio is computed as the ratio of tied assets to free assets. Based on the statutory method of declaration in accordance with art. 44 para. 1 BVV 2, the funding ratio amounted to 126.1 percent. This means that the financial situation has been significantly strengthened compared to the previous year and that the fluctuation reserves are at their target level. Hence, the capacity of Novartis Pension Fund 1 to manage financial risk is deemed unrestricted within the frame-work of its strategic asset allocation. Also reflected in the funding ratio are the substantial increases of the actuarial reserves for pensions over the past years and the provisions made for financing compensation credits in the context of the conversion rate adjustments enacted in January 2022. With all these measures, due account was taken of the persistent low interest rate levels and the continuously rising life expectancy.
Performance
The global equity rally continued well into Q3, support-ed by robust corporate earnings, and continued monetary policy support. After equity markets hit record highs in August, new concerns about growth and central bank policies began to cloud investor sentiment in September. The final quarter parallels the situation at the end of the previous year, as equities, particularly in the developed world, once again hit record highs despite the rapid spread of a new Covid 19 variant, although some emerging markets, including China, ended the year in negative territory. As a result of higher-than-expected inflation, US interest rates in particular rose sharply in the year under review, which in turn led to negative returns in most bond markets. Equities again proved to be the strongest asset class with a gain of 17.85% since the beginning of the year, followed by infrastructure investments (14.80%), hedge funds (8.99%) and real estate (8.24%). Bonds showed a slightly improved, but still negative overall return of –1.36% compared to the first quarter. The relative strength of the Swiss franc had a negative impact on foreign currencies (–0.53%).
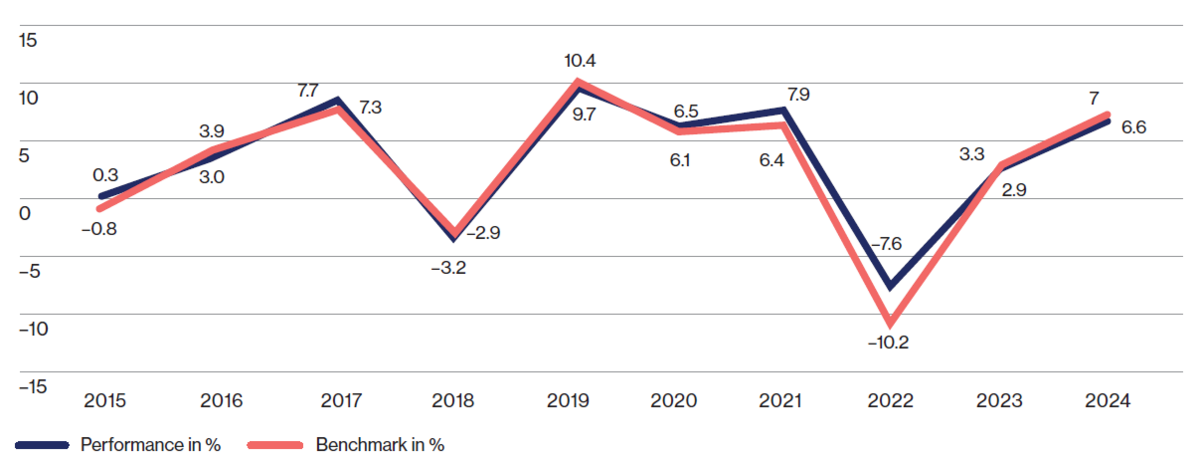
Overall, with positive contributions from all asset class-es, except cash, bonds and foreign currencies, the YTD performance for Pension Fund 1 was up by 7.89%, exceeding the benchmark (6.36%) by 153 base points.
Are you interested in further information?
As a member of the Novartis Pension Funds, you may obtain the detailed Annual Report for 2021 from the Pension Fund Team: Please feel free to call
+41 61 324 24 20 or email to:
markus-pk.moser@novartis.com